Originally published in the August 2012 Intelligent Investor, Part 2 (expanded to include previous publications)
The large wealth and income inequality in the U.S. has continued to widen for nearly three decades. Over the past few years the disparity has become even larger. For instance, the top 1% of income earners in the U.S. account for 21% of aggregate income.
Meanwhile, the wealthiest 1% own about 35% of the nation’s wealth. Finally, the top 20% of income earners account for nearly 40% of total consumption (more detail on this topic has been presented in several previous issues).
My first discussion of the wealth and income disparity in the United States began in America’s Financial Apocalypse. This book was released in 2006 when discussion of this topic was considered somewhat ridiculous to those in the investment world.
Washington likes to remind critics that Americans enjoy the highest living standard in the world. As evidence of this, government “experts” discuss statistics such as GDP growth, wealth, income and wage growth, and other economic indicators without defining exactly what they are referring to (see Chapter Eleven for a detailed discussion).
In fact, when one examines the data, it’s clear that only America’s wealthiest 5 percent have benefited from the credit-driven economic expansion that began over two decades ago.
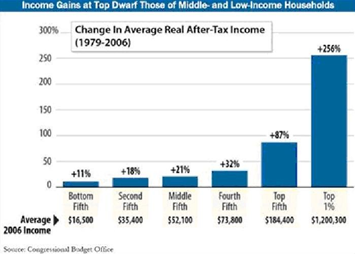
Shortly after 1980, real incomes of the top 5 percent of Americans soared over the next two decades from about 3.5 times to 5.5 times the median income (in 2001 dollars).
In contrast, real incomes for the bottom 80 percent of Americans barely moved during this period, while inflation for basic necessities (such as healthcare, energy, and higher education) soared. These increased expenses have further reduced the disposable income of the majority of Americans.
In contrast, the post-war economic expansion was much more evenly distributed across all wage earners. This balanced expansion continued until the high inflation period of the early ‘80s.
Even more disturbing is that America’s wealth disparity is much greater, with the top 5 percent having accounted for a much larger percentage of wealth growth from the decade since 1979 than the bottom 95 percent.
Ten years later, the results are even worse, with the wealthiest 5 percent of Americans having on average 23 times the wealth of the remaining 95 percent. The problem is that households with low net worth have very few assets and will therefore be affected more by price increases in basic necessities.
In addition, they will be less able to weather unexpected difficulties, such as medical emergencies or a job loss. Accordingly, Edward Wolff has estimated that 40 percent of households headed by individuals aged 25 to 54 could exhaust all of their financial assets (excluding their home) within 1 week if they lost their income.
While America’s wealthiest 5 percent have received a much greater percentage of the nation’s wealth for over two decades, the remaining 95 percent have benefited very little. When we compare top and bottom income and wealth levels to other nations, America begins to resemble the land of opportunity for only a select few.
America’s poorest 10 percent has less purchasing power than almost every other developed nation. Meanwhile, its wealthiest 20 percent own almost 80 percent of all household wealth (figure 4-5). And compared to other developed nations, America has the largest income gap between the top 10 percent of income earners and the median income, as well as the largest gap between median income and the lowest 10 percent of income earners.
.png)
.png)
.png)
.png)
.png)
.png)
Finally, the U.S. government does much less to help raise the living standards of its impoverished citizens compared to other developed nations.
What was once a nation of fairness, opportunity and moderation has become a nation of favoritism and extremes. Some view America’s economic strength to be confirmed by the annual growth of new millionaires. However, this has come at the expense of shifting more Americans into poverty or near poverty.
Two decades ago, most Americans began to use credit to purchase goods and services that they couldn’t afford. And during the 1990s, this greed became more intense. Today we see the effects of three decades of economic decline, as many now use their credit cards to pay for basic necessities.
To illustrate these consumption trends, consider the American staple; the house. Three decades ago, the average American family consisted of about 4.5 individuals with an average home size of about 2200 square feet.
Today, with about 3.6 family members, the average family now has a home that’s about 3500 square feet. That represents an increase in size (per individual) of 100 percent. Instead of having fewer bedrooms, the average home now has more. As well, today’s average new home has many additional rooms that didn’t exist in the past such as a study, an entertainment room, Jacuzzi room, and others.
These consumption trends have extended to the number and size of autos, televisions, and other goods purchased by the average American family.
Americans need to ask themselves if they really need to consume so much, and if so, whether they’re producing enough to justify such consumption. Data shows that they are consuming much more than they are producing. And this is gradually causing them to mortgage their nation off to foreigners.
.png)
.png)
.png)
.png)
.png)
.png)
Similar to many third-world nations that have an inadequate manufacturing infrastructure, America has reverted to a service economy. It’s becoming a nation of the ‘haves and have nots,’ similar to third-world societies. The ‘have-nots’ continue to reach for what they cannot afford through credit spending. In some cases, we already see a change in the way Americans are using credit; from greed to need—paying for necessities with their credit cards.
Source: America’s Financial Apocalypse, 2006.
In late 2010, I discussed more recent poverty data.
In 2009 Americans earning more than $100,000, or 20% of the U.S. population received 50.3% of the nation’s total income. In contrast, the bottom 40% of Americans received a mere 12% of the nation’s income. Americans considered below the government’s official poverty line (14.3%) received only 3.4% of the income.
For the nation’s top 20% of income earners, this represents an increase from a decade ago in 1999, when the top 20% received 49.4% of the income. Meanwhile, the nation’s poorest were slightly better off a decade ago, when the bottom 40% received 12.5% of the income.
This is remarkable considering the fact that higher-income earners were likely to have lost a significant amount of their wealth (and income due to dividends and capital gains) from stock market losses, whereas the nation’s lowest income earners were much less likely to have suffered losses in the stock market.
In 2008, the wealthiest 10% of U.S. households received 48.2% of the nation’s total income, up from 34.6% in 1980. Thus, much of this increase was due to the growth of incomes in the top 10% of income earners.
Specifically, the top 1% received a much higher percentage in gains, helping to raise the 20% group. Between 1980 and 2008, the share of the nation’s total income going to the top 1% rose from 10% to 21%. This places the U.S. as one of the most unequal nations in the world.
I have discussed the fact that real median wages have not increased since 1999 ever since writing about this trend in America’s Financial Apocalypse. The latest data by the Census confirms this trend is alive and well. According to the Census, the inflation-adjusted income of the median U.S. household fell 4.8% between 2000 and 2009.
What does all of this mean?
As I discussed in America’s Financial Apocalypse and have continued to emphasize since that time, America’s middle-class is becoming extinct.
.png)
.png) Meanwhile, the impoverished are becoming poorer. The main reason for this trend is due to the excessive inflation seen in basic goods and services, such as food, energy, healthcare and education, all while Washington partners with corporate America to send good jobs overseas in order to enrich the wealthy elite.
Meanwhile, the impoverished are becoming poorer. The main reason for this trend is due to the excessive inflation seen in basic goods and services, such as food, energy, healthcare and education, all while Washington partners with corporate America to send good jobs overseas in order to enrich the wealthy elite.
.png)
.png) The topic of U.S. trade policy is one that I have been detailing ever since my first discussion in America’s Financial Apocalypse. Good jobs, millions of them have been exported overseas by corporations only concerned with locating the source of cheapest labor. This has a dual effect on the wealth and income gap seen in the U.S. because the wealthiest Americans tend to have largest investments in U.S. corporations.
The topic of U.S. trade policy is one that I have been detailing ever since my first discussion in America’s Financial Apocalypse. Good jobs, millions of them have been exported overseas by corporations only concerned with locating the source of cheapest labor. This has a dual effect on the wealth and income gap seen in the U.S. because the wealthiest Americans tend to have largest investments in U.S. corporations.
As Ford Motor, Dell Computers, IBM, and every other U.S. corporation sends jobs to China, India, and other nations, shareholders of these companies make more money because labor costs have been reduced.

 The simple fact of the matter is every time you see someone driving an expensive car or pulling up to a large house, you should by no means envy this person.
Most likely, this individual is either in some way responsible for the job you once had before it was shipped off to India, or else this wealthy individual has profited from your lost job. This is the new never-mentioned reality of America.
So how did the top 1% benefit disproportionately from the gains made by U.S. productivity over the past several decades?
There are many reasons accounting for the wealth and income inequality in the U.S. Certainly, they reaped tremendous benefits as large shareholders of U.S. equities.
But they also received a large proportion of benefits through the advantageous laws and tax breaks afforded to their businesses, as well as their estates.
Regardless their source of income, personal tax rates have provided a large chunk of the gains from the economic productivity over the past several decades.
There are many other obvious factors, such as suppression of the minimum wage and the effects of globalization (so-called “free trade,” illegal alien immigration, and declining union membership). Among OECD (developed nations) the United States has the highest percentage of workers earning low wages.
In addition, the incidence of low-wage work in the U.S. has been rising for more than three decades. This is great news for domestic-based corporations, but terrible news for those interested in maintaining a strong economy driven by consumer demand.
Today, nearly 50% of the U.S. population is receiving some form of government.png)
.png) assistance, up from 30% in the early 1980s.
assistance, up from 30% in the early 1980s.
In addition to other factors such as declining union membership and globalization, the shift in retirement savings plans from defined benefit to defined contribution has been a significant contributor to the wealth and income inequality. The gradual shift from pension to 401(k) plans has been one of the most commonly underappreciated factors that have led to inequality.
.png)
.png) Over the past three decades, U.S. corporations have reduced or eliminated their private pension plans (defined benefit plans), replacing them with less expensive defined contribution or 401(k) plans.
Over the past three decades, U.S. corporations have reduced or eliminated their private pension plans (defined benefit plans), replacing them with less expensive defined contribution or 401(k) plans.
Today, defined benefit pensions now make up only 3% of private sector pensions in the U.S. Public employee pension programs are also in decline and will continue to shrink due to budget pressures.
Why is the issue of income inequality significant?
Besides its importance as a foundation of equity, societies with high levels of income inequality have historically instituted economic policies that have fallen short of their long-term economic growth potential.
But there are many additional side effects seen in nations with high levels of income inequality, such as the formation of a “class society,” reduced intergenerational mobility and so forth. These are issues that can lead to social unrest and political uprisings if not civil war.
Short of radical domestic and foreign economic policy changes, the easiest method to mitigate income inequality is through implementation of progressive tax and transfer policies. However, this in itself is not necessarily an effective approach. .png)
.png)
For instance, U.S. tax and transfer policies are among one of the least effective in reducing income inequality. Thus, specific allocation of basic resources is to low income groups is also needed to ensure they can focus on improving their economic status.
.png)
.png) The most common method used to measure income inequality across nations is the Gini coefficient. This is an index ranging from 0 to 1, with a value of 0 corresponding to equal incomes across the population, while a value of 1 corresponds to all of the income being received by one household.
The most common method used to measure income inequality across nations is the Gini coefficient. This is an index ranging from 0 to 1, with a value of 0 corresponding to equal incomes across the population, while a value of 1 corresponds to all of the income being received by one household.
Although most nations have changed their economic policies over the decades resulting in various changes to income inequality, it is thought that one of the leading driving forces behind an increase in income equality throughout the globe over the past four decades has been due to skill-based technological change. According to this theory, the middle class has received the brunt of the effect of technological innovations due to their replacement in the work force with machines, robotics and other automated devices.
.png)
.png)
.png)
.png)
.png)
.png)
We believe that the primary factor that has contributed to the largest increase in income inequality in developed nations over the past two decades has been globalization. When economists attribute the impact of globalization to increases in income inequality in the developed world, they usually distinguish between globalization, reduction (relative to inflation) in minimum wage, and the decline union membership and influence. As you can appreciate, these latter two factors are really offshoots of globalization.
Increased access to low-income nations due to the mandates of globalization has caused corporations to gain much more bargaining power over employees. As a result, wages have been selectively suppressed at the lower end of the labor force due to the competitive effects of outsourcing.
As well, this same dynamic of so-called “open competition” has led to the decline of unions and other vehicles for collective bargaining. For instance, the percentage of private sector workers covered by unions in the U.S. declined from over 20% in the mid-1970s, to less than 10% in 2010.
Unions have also been weakened by the increased use of illegal immigrant labor. Furthermore, minimum wage increases have not kept up with inflation for many years. In part, illegal immigration has helped suppress cost-of-living increases to minimum wage. This has been a problem in many nations in addition to the U.S.
Of course, the competitive effects utilized by corporations have not been adjusted for other economic factors from nation to nation. As a result, globalization has permitted nations in the advanced world to exploit various macroeconomic disparities in developing nations for their own benefit, leaving domestic workers in the dust.
Some of these disparities include different trade laws and regulations, differences in government social transfers between nations, differing laws regarding collective bargaining, employer-based versus universal healthcare, national versus employer-based pensions and so forth.
Finally, the rapid growth and exorbitant compensation plans seen in the financial sector have also been responsible for rising income inequality.
Restrictions Against Reproduction: No part of this publication may be reproduced, stored in a retrieval system, or transmitted in any form or by any means, electronic, mechanical, photocopying, recording, scanning, or otherwise, except as permitted under Section 107 or 108 of the 1976 United States Copyright Act, without the prior written permission of the copyright owner and the Publisher.
These articles and commentaries cannot be reposted or used in any publications for which there is any revenue generated directly or indirectly. These articles cannot be used to enhance the viewer appeal of any website, including any ad revenue on the website, other than those sites for which specific written permission has been granted. Any such violations are unlawful and violators will be prosecuted in accordance with these laws.
Article 19 of the United Nations' Universal Declaration of Human Rights: Everyone has the right to freedom of opinion and expression; this right includes freedom to hold opinions without interference and to seek, receive and impart information and ideas through any media and regardless of frontiers.
This publication (written, audio and video) represents the commentary and/or criticisms from Mike Stathis or other individuals affiliated with Mike Stathis or AVA Investment Analytics (referred to hereafter as the “author”). Therefore, the commentary and/or criticisms only serve as an opinion and therefore should not be taken to be factual representations, regardless of what might be stated in these commentaries/criticisms. There is always a possibility that the author has made one or more unintentional errors, misspoke, misinterpreted information, and/or excluded information which might have altered the commentary and/or criticisms. Hence, you are advised to conduct your own independent investigations so that you can form your own conclusions. We encourage the public to contact us if we have made any errors in statements or assumptions. We also encourage the public to contact us if we have left out relevant information which might alter our conclusions. We cannot promise a response, but we will consider all valid information.
I find it ridiculous that Washington has led America into another trap by supporting ethanol. By now, we all know how expensive it is to produce ethanol from agricultural sources. This is especially t...

.png)
.png)