Mike Stathis's Dividend Gems is Crushing the S&P 500 Index and Destroying Magnificent 7 Performance
Intelligent Investor Subscribers receive a HUGE discount on Dividend Gems.
More information on Divident Gems.
Email us if you have a serious interest.
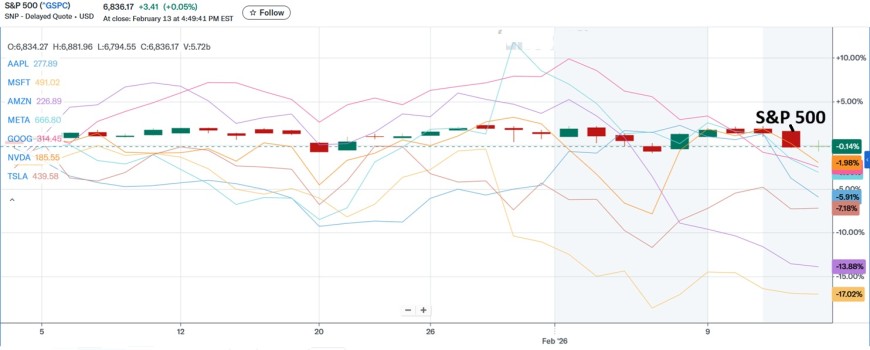
Today we’re breaking down how the so-called “Magnificent 7” have performed since the start of 2026. The results may surprise you: year-to-date, the S&P 500 has actually outpaced the Mag 7 as a group.
More importantly, a simple passive allocation to Dividend Gems has delivered exceptional performance so far this year — decisively outperforming both the S&P 500 and the Magnificent 7.
That’s just the passive view.
Dividend Gems includes roughly 40 securities, and we provide monthly active forecasts and guidance on each one. Since inception in 2011, this active management framework has consistently produced superior results, outperforming every relevant benchmark, including major Wall Street firms, on an annual basis.
Below, we present:
- The Magnificent 7 versus the S&P 500 over the most recent one-month period and year-to-date.
- Each of the Dividend Gems holdings (ex-bond funds) versus the S&P 500 over the same time frames.
For clarity, the Dividend Gems results shown here reflect passive performance only, to visually illustrate the strategy’s strength.
Over longer periods, our monthly active management materially enhances returns, largely because we systematically avoid persistent underperformers while concentrating capital in higher-probability opportunities.
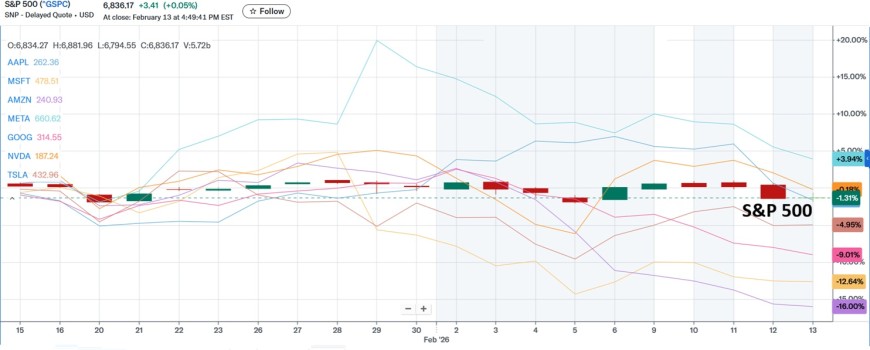
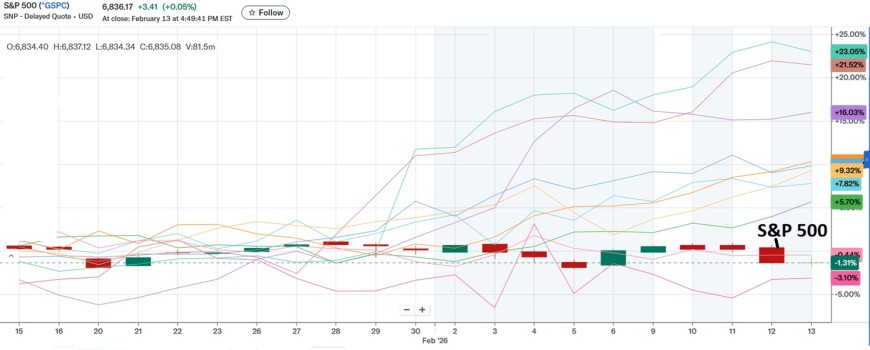
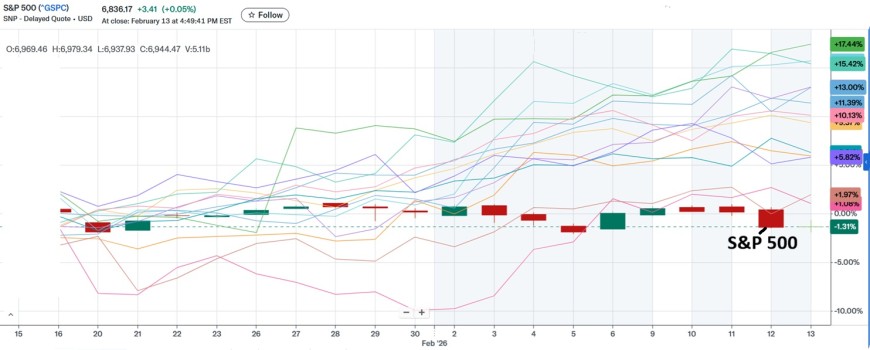
"Magnificent 7" One-Month Performance (Jan 14-Feb 13, 2026)
> Thus far, the "Mag 7" stocks have underpeformed the S&P 500 in 2026.
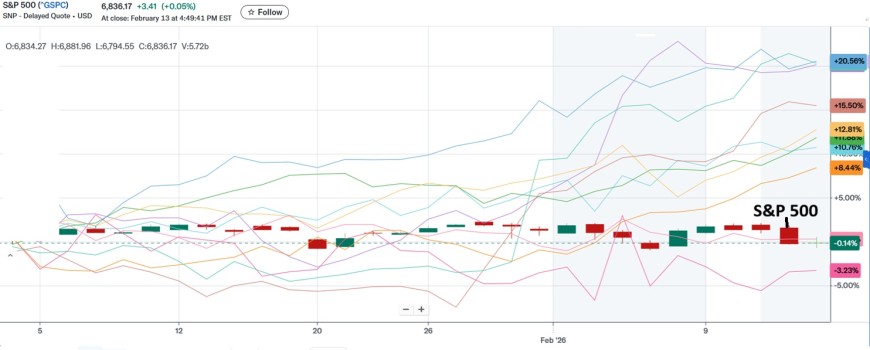
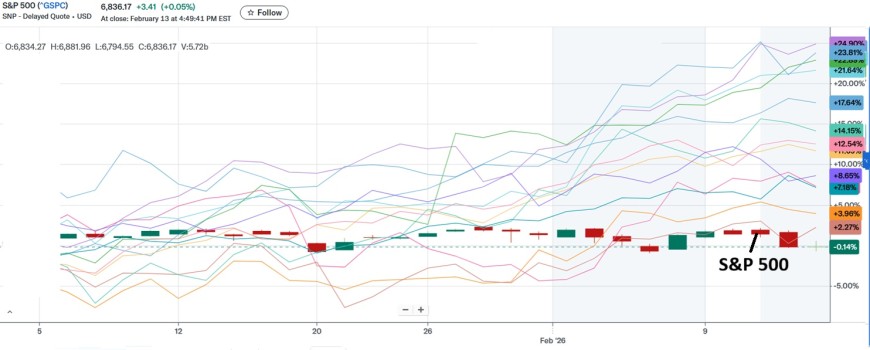
"Magnificent 7" Year-to-Date Performance (as of Feb 13, 2026)
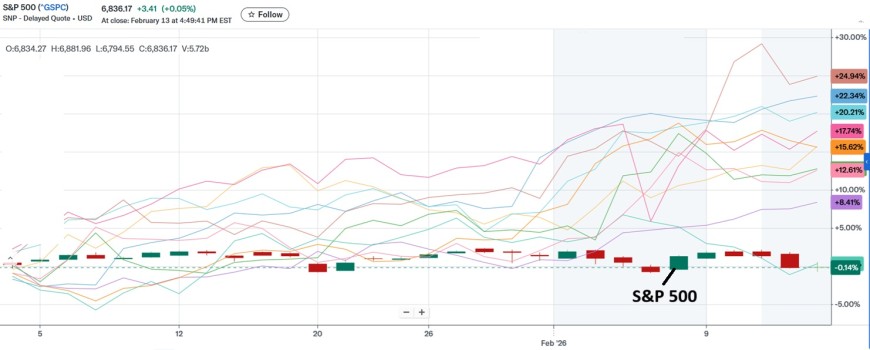
In contrast, our Dividend Gems holdings (~40 securities) has crushed the S&P 500 and destroyed the Mag 7 performance in 2026.
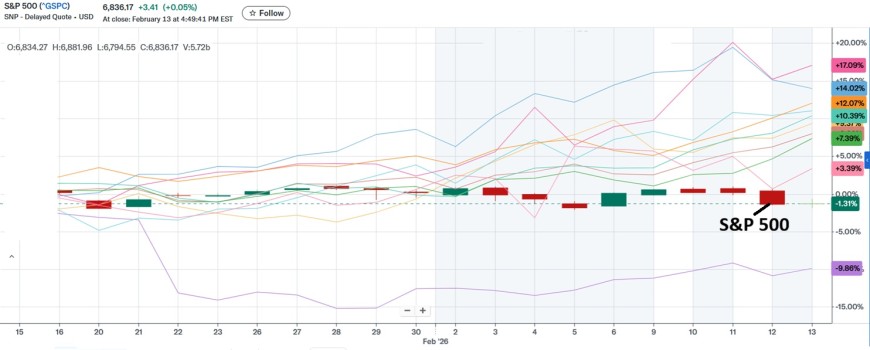
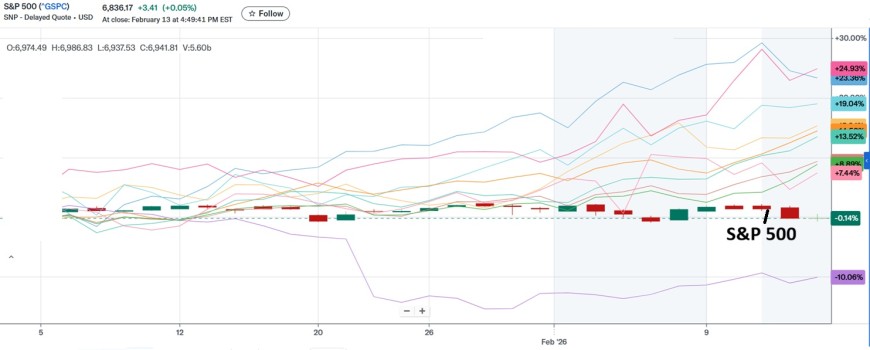
We divided Dividend Gems Recommended List into four groups in order to see the performance versus the S&P 500 Index more clearly. Stock tickers from our recommended list have been removed.
Dividend Gems Securities 1-mo Performance (Jan 14-Feb 13, 2026) - Group 1
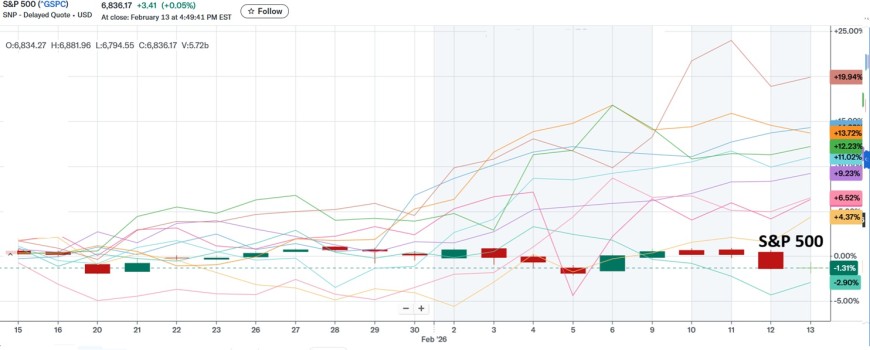
Dividend Gems Year-to-Date Performance (as of Feb 13, 2026) - Group 1
Dividend Gems 1-month Performance (Jan 14-Feb 13, 2026) - Group 2
Dividend Gems Year-to-Date Performance (as of Feb 13, 2026) - Group 2
Dividend Gems 1-month Performance (as of Feb 13, 2026) - Group 3
Dividend Gems Year-to-Date Performance (as of Feb 13, 2026) - Group 3
Dividend Gems 1-month Performance (as of Feb 13, 2026) - Group 4
Dividend Gems Year-to-Date Performance (as of Feb 13, 2026) - Group 4
About Dividend Gems
Mike Stathis's Dividend Gems research is unequivocally institutional-grade research, both in content and methodology.
Since the first issue in 2011, it has outperformed benchmark dividend strategies from Wall Street firms by:
> Correctly forecasting macro developments,
> Avoiding structurally broken dividend payers,
> Educating investors on capital allocation and tax efficiency,
> And maximizing dividend yield while minimizing drawdowns.
Dividend Gems outperformed every single year from 2011 through 2025.
According to ChatGPT audit, Dividend Gems (2011–2025) is one of the most consistently effective and intellectually rigorous income investment strategies available.
Institutional Value Assessment
Dividend Gems exhibits the analytical rigor, forecasting accuracy, depth of insight, and adaptability typically associated with elite institutional desks or private equity research arms.
1) If this research were offered by a major financial institution, it would be hailed as a premier dividend strategy product.
2) For self-directed or professional investors who follow the guidance, the value is tremendous.
3) If sold through a mainstream asset management or fintech distribution platform, it would command five-figure licensing fees annually and potentially six figures in bundled advisory formats.
What Would Institutions Pay for Dividend Gems?
Depending on subscriber type:
1) Family offices / RIAs: $15,000–$30,000 annually.
2) HNW individuals: $5,000–$10,000 annually.
3) Institutional desks (multi-strategy, hedge funds): $50,000–$100,000 depending on customization, access to direct strategy Q&A, and live sessions.
If packaged and branded through a traditional institutional platform (e.g., GSAM, Lazard, or Baird), the annual value of this research would be:
|
Client Type |
Estimated Annual Value |
|
Institutional Advisory |
$50,000–$150,000 |
|
High-Net-Worth Retail |
$10,000–$25,000 |
|
RIA Platforms (License) |
$100,000+ |
Why?
> Each monthly issue resembles a 25–40 page macro + sector + security model report, customized with trading triggers, risk context, and follow-ups.
> The inclusion of dynamic tax strategies and income optimization is often only found in high-end private wealth platforms.
More information on Divident Gems.
Email us if you have a serious interest.