How to Think Clearly
"Never argue with stupid people. They will drag you down to their level and then beat you with experience." –Mark Twain
If you want to fully understand and appreciate the work of Mike Stathis, from his market forecasts and securities analysis to his political and economic analyses, you will need to learn how to think clearly if you already lack this vital skill.
For many, this will be a cleansing process that could take quite a long time to complete depending on each individual.
The best way to begin clearing your mind is to move forward with this series of steps:
1. GET RID OF YOUR TV SET, AND ONLY USE STREAMING SERVICES SPARINGLY.
2. REFUSE TO USE YOUR PHONE TO TEXT.
3. DO NOT USE A "SMART (DUMB) PHONE" (or at least do not use your phone to browse the Internet unless absolutely necessary).
4. STAY AWAY FROM SOCIAL MEDIA (Facebook, Instagram, Whatsapp, Snap, Twitter, Tik Tok unless it is to spread links to this site).
5. STAY OFF JEWTUBE.
6. AVOID ALL MEDIA (as much as possible).
The cleansing process will take time but you can hasten the process by being proactive in exercising your mind.
You should also be aware of a very common behavior exhibited by humans who have been exposed to the various aspects of modern society. This behavior occurs when an individual overestimates his abilities and knowledge, while underestimating his weaknesses and lack of understanding. This behavior has been coined the "Dunning-Kruger Effect" after two sociologists who described it in a research publication. See here.
Many people today think they are virtual experts on every topic they place importance on. The reason for this illusory behavior is because these individuals typically allow themselves to become brainwashed by various media outlets and bogus online sources. The more information these individuals obtain on these topics, the more qualified they feel they are to share their views with others without realizing the media is not a valid source with which to use for understanding something. The media always has bias and can never be relied on to represent the full truth. Furthermore, online sources are even more dangerous for misinformation, especially due to the fact that search algorithms have been designed to create confirmation bias.
A perfect example of the Dunning-Kruger Effect can be seen with many individuals who listen to talk radio shows. These shows are often politically biased and consist of individuals who resemble used car salesmen more than intellectuals. These talking heads brainwash their audience with cherry-picked facts, misstatements, and lies regarding relevant issues such as healthcare, immigration, Social Security, Medicaid, economics, science, and so forth. They also select guests to interview based on the agendas they wish to fulfill with their advertisers rather than interviewing unbiased experts who might share different viewpoints than the host.
Once the audience has been indoctrinated by these propagandists, they feel qualified to discuss these topics on the same level as a real authority, without realizing that they obtained their understanding from individuals who are employed as professional liars and manipulators by the media.
Another good example of the Dunning-Kruger Effect can be seen upon examination of political pundits, stock market and economic analysts on TV. They talk a good game because they are professional speakers. But once you examine their track record, it is clear that these individuals are largely wrong. But they have developed confidence in speaking about these topics due to an inflated sense of expertise in topics for which they continuously demonstrate their incompetence.
One of the most insightful analogies created to explain how things are often not what you see was Plato's Allegory of the Cave, from Book 7 of the Republic.
We highly recommend that you study this masterpiece in great detail so that you are better able to use logic and reason. From there, we recommend other classics from Greek philosophers. After all, ancient Greek philosophers like Plato and Socrates created critical thinking.
If you can learn how to think like a philosopher, ideally one of the great ancient Greek philosophers, it is highly unlikely that you will ever be fooled by con artists like those who make ridiculous and unfounded claims in order to pump gold and silver, the typical get-rich-quick, or multi-level marketing (MLM) crowd.
STOP Being Taken
If you want to do well as an investor, you must first understand how various forces are seeking to deceive you.
Most people understand that Wall Street is looking to take their money.
But do they really understand the means by which Wall Street achieves these objectives?
Once you understand the various tricks and scams practiced by Wall Street you will be better able to avoid being taken.
Perhaps an even greater threat to investors is the financial media.
The single most important thing investors must do if they aim to become successful is to stay clear of all media.
That includes social media and other online platforms with investment content such as YouTube and Facebook, which are one million times worse than the financial media.
The various resources found within this website address these two issues and much more.
Remember, you can have access to the best investment research in the world. But without adequate judgment, you will not do well as an investor.
You must also understand how the Wall Street and financial media parasites operate in order to do well as an investor.
It is important to understand how the Jewish mafia operates so that you can beat them at their own game.
The Jewish mafia runs both Wall Street and the media. This cabal also runs many other industries.
We devote a great deal of effort exposing the Jewish mafia in order to position investors with a higher success rate in achieving their investment goals.
Always remember the following quotes as they apply to the various charlatans positioned by the media as experts and business leaders.
“Beware of false prophets, which come to you in sheep's clothing, but inwardly they are ravening wolves.” - King James Bible - Matthew 7:15
"It's easier to fool people than to convince them that they have been fooled." –Mark Twain
It's also very important to remember this FACT. All Viewpoints Are Not Created Equal.
Just because something is published in print, online, or aired in broadcast media does not make it accurate.
More often than not, the larger the audience, the more likely the content is either inaccurate or slanted.
The next time you read something about economics or investments, you should ask the following question in order to determine the credibility of the source.
Is the source biased in any way?
That is, does the source have any agendas which would provide some kind of benefit accounting for conclusions that were made?
Most individuals who operate websites or blogs sell ads or merchandise of some kind. In particular, websites that sell precious metals are not credible sources of information because the views published on these sites are biased and cannot be relied upon.
The following question is one of the first things you should ask before trusting anyone who is positioned as an expert.
Is the person truly credible?
Most people associate credibility with name-recognition. But more often than not, name-recognition serves as a predictor of bias if not lack of credibility because the more a name is recognized, the more the individual has been plastered in the media.
Most individuals who have been provided with media exposure are either naive or clueless. The media positions these types of individuals as “credible experts” in order to please its financial sponsors; those who buy advertisements.
In the case of the financial genre, instead of name-recognition or media celebrity status, you must determine whether your source has relevant experience on Wall Street as opposed to being self-taught. But this is just a basic hurdle that in itself by no means ensures the source is competent or credible.
It's much more important to carefully examine the track record of your source in depth, looking for accuracy and specific forecasts rather than open-ended statements. You must also look for timing since a broken clock is always right once a day. Finally, make sure they do not cherry-pick their best calls. Always examine their entire track record.
Don't ever believe the claims made by the source or the host interviewing the source regarding their track record.
Always verify their track record yourself.
The above question requires only slight modification for use in determining the credibility of sources that discuss other topics, such as politics, healthcare, etc.
We have compiled the most extensive publication exposing hundreds of con men pertaining to the financial publishing and securities industry, although we also cover numerous con men in the media and other front groups since they are all associated in some way with each other.
There is perhaps no one else in the world capable of shedding the full light on these con men other than Mike Stathis.
Mike has been a professional in the financial industry for nearly three decades.
Alhough he publishes numerous articles and videos addressing the dark side of the industry, the core collection can be found in our ENCYCLOPEDIA of Bozos, Hacks, Snake Oil Salesmen and Faux Heroes.
Also, the Image Library contains nearly 8,000 images, most of which are annotated.
At AVA Investment Analytics, we don't pump gold, silver, or equities because we are not promoters or marketers.
We actually expose precious metals pumpers, while revealing their motives, means, and methods.
We do not sell advertisements.
We actually go to great lengths to expose the ad-based content scam that's so pervasive in the world today.
We do not receive any compensation from our content, other than from our investment research, which is not located on this website.
We provide individual investors, financial advisers, analysts and fund managers with world-class research and unique insight.
Media Lies
If you listen to the media, most likely at minimum it's going to cost you hundreds of thousands of dollars over the course of your life time.
The deceit, lies, and useless guidance from the financial media is certainly a large contributor of these losses.
But a good deal of lost wealth comes in the form of excessive consumerism which the media encourages and even imposes upon its audience.
You aren’t going to know that you’re being brainwashed, or that you have lost $1 million or $2 million over your life time due to the media.
But I can guarantee you that with rare exception this will become the reality for those who are naïve enough to waste time on media.
It gets worse.
By listening to the media you are likely to also suffer ill health effects through excessive consumption of prescription drugs, and/or as a result of watching ridiculous medical shows, all of which are supportive of the medical-industrial complex.
And if you seek out the so-called "alternative media" as a means by which to escape the toxic nature of the "mainstream" media, you might make the mistake of relying on con men like Kevin Trudeau, Alex Jones, Joe Rogan, and many others.
This could be a deadly decision. As bad as the so-called "mainstream" media is, the so-called "alternative media" is even worse.
There are countless con artists spread throughout the media who operate in the same manner. They pretend to be on your side as they "expose" the "evil" government and corporations.
Their aim is to scare you into buying their alternatives. This addresses the nutritional supplements industry which has become a huge scam.
Why Does the Media Air Liars and Con Men?
The goal of the media is NOT to serve its audience because the audience does NOT pay its bills.
The goal of the media is to please its sponsors, or the companies that spend huge dollars buying advertisements.
And in order for companies to justify these expenses, they need the media to represent their cause.
The media does this by airing idiots and con artists who mislead and confuse the audience.
By engaging in "journalistic fraud," the media steers its audience into the arms of its advertisers because the audience is now misled and confused.
The financial media sets up the audience so that they become needy after having lost large amounts of money listening to their "experts." Desperate for professional help, the audience contacts Wall Street brokerage firms, mutual funds, insurance companies, and precious metals dealers that are aired on financial networks. This is why these firms pay big money for adverting slots in the financial media.
We see the same thing on a more obvious note in the so-called "alternative media," which is really a remanufactured version of the "mainstream media." Do not be fooled. There is no such thing as the "alternative media." It really all the same.
In order to be considered "media" you must have content that has widespread channels of distribution. Thus, all "media" is widely distributed.
And the same powers that control the distribution of the so-called "mainstream media" also control distribution of the so-called "alternative media."
The claim that there is an "alternative media" is merely a sales pitch designed to capture the audience that has since given up on the "mainstream media."
The tactic is a very common one used by con men.
The same tactic is used by Washington to convince naive voters that there are meaningful differences between the nation's two political parties.
In reality, both parties are essentially the same when it comes to issues that matter most (e.g. trade policy and healthcare) because all U.S. politicians are controlled by corporate America. Anyone who tells you anything different simply isn't thinking straight.
On this site, we expose the lies and the liars in the media.
We discuss and reveal the motives and track record of the media’s hand-selected charlatans with a focus on the financial media.
Why Stathis Was Banned
To date, we know of no one who has established a more accurate track record in the investment markets since 2006 than Mike Stathis.
Yet, the financial media wants nothing to do with Stathis.
This has been the case from day one when he was black-balled by the publishing industry after having written his landmark 2006 book, America's Financial Apocalypse.
From that point on, he was black-balled throughout all so-called mainstream media and then even the so-called alternative media.
With very rare exception, you aren't even going to hear him on the radio or anywhere else being interviewed.
Ask yourself why.

You aren't going to see him mentioned on any websites either, unless its by people whom he has exposed.
You aren't likely to ever read or hear of his remarkable investment research track record anywhere, unless you read about it on this website.
You should be wondering why this might be.
Some of you already know the answer.
The media banned Mike Stathis because the trick used by the media is to promote cons and clowns so that the audience will be steered into the hands of the media's financial sponsors - Wall Street, gold dealers, etc.
Because the media is run by the Jewish mafia and because most Jews practice a severe form of tribalism, the media will only promote Jews and gentiles who represent Jewish businesses.
And as for radio shows and websites that either don't know about Stathis or don't care to hear what he has to say, the fact is that they are so ignorant that they assume those who are plastered throughout media are credible.
And because they haven't heard Stathis anywhere in the media, even if they come across him, they automatically assume he's a nobody in the investment world simply because he has no media exposure. And they are too lazy to go through his work because they realize they are too stupid to understand the accuracy and relevance of his research.
Top investment professionals who know about Mike Stathis' track record have a much different view of him. But they cannot say so in public because Stathis is now considered a "controversial" figure due to his stance on the Jewish mafia.
Most people are in it for themselves. Thus, they only care about pitching what’s deemed as the “hot” topic because this sells ads in terms of more site visits or reads.
This is why you come across so many websites based on doom and conspiratorial horse shit run by con artists.
We have donated countless hours and huge sums of money towards the pursuit of exposing the con men, lies, and fraud.
We have been banned by virtually every media platform in the U.S and every website prior to writing about the Jewish mafia.
Mike Stathis was banned by all media early on because he exposed the realities of the United States.
The Jewish mafia has declared war on us because we have exposed the realities of the U.S. government, Wall Street, corporate America, free trade, U.S. healthcare, and much more.
Stathis has also been banned by alternative media because he exposed the truth about gold and silver.
We have even been banned from use of email marketing providers as a way to cripple our abilities to expand our reach.
You can talk about the Italian Mafia, and Jewish Hollywood can make 100s of movies about it.
BUT YOU CANNOT TALK ABOUT THE JEWISH MAFIA.
Because Mr. Stathis exposed so much in his 2006 book America's Financial Apocalypse, he was banned.
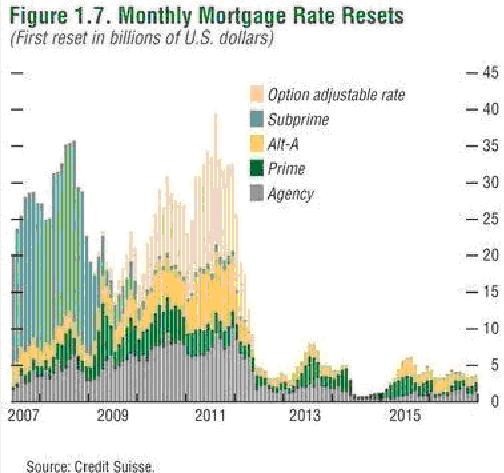
He was banned for writing about the following topics in detail: political correctness, illegal immigration, affirmative action, as well as the economic realities behind America's disastrous healthcare system, the destructive impact of free trade, and many other topics. He also exposed Wall Street fraud and the mortgage derivatives scam that would end of catalyzing the worst global crisis in history.
It's critical to note that the widespread ban on Mr. Stathis began well before he mentioned the Jewish mafia or even Jewish control of any kind.
It was in fact his ban that led him to realize precisely what was going on.
We only began discussing the role of the criminality of the Jewish mafia by late-2009, three years AFTER we had been black-listed by the media.
Therefore, no one can say that our criticism of the Jewish mafia led to Mike being black-listed (not that it would even be acceptable).
If you dare to expose Jewish control or anything under Jewish control, you will be black-balled by all media so the masses will never hear the truth.
Just remember this. Mike does not have to do what he is doing.
Instead, he could do what everyone else does and focus on making money.
He has already sacrificed a huge fortune to speak the truth hoping to help people steer clear of fraudsters and to educate people as to the realities in order to prevent the complete enslavement of world citizenry.
Rules to Remember
Rule #1: Those With Significant Exposure Are NOT on Your Side.
No one who has significant exposure should ever be trusted. Such individuals should be assumed to be gatekeepers until proven otherwise. I have never found an exception to this rule.
Understand that those responsible for permitting or even facilitating exposure have given exposure to specific individuals for a very good reason. And that reason does not serve your best interests.
In short, I have significant empirical evidence to conclude that everyone who has a significant amount of exposure has been bought off (in some way) by those seeking to distort reality and control the masses. This is not a difficult concept to grasp. It's propaganda 101.
Rule #2: Con Artists Like to Form Syndicates.
Before the Internet was created, con artists were largely on their own. Once the Internet was released to the civilian population, con artists realized that digital connectivity could amplify their reach, and thus the effectiveness of their mind control tactics. This meant digital connectivity could amplify the money con artists extract from their victims by forming alliances with other con artists.
Teaming up with con artists leads to a significantly greater volume of content and distraction, such that victims of these con artists are more likely to remain trapped within the web of deceit, as well as being more convinced that their favorite con artist is legit.
Whenever you wish to know whether someone can be trusted, always remember this golden rule..."a man is judged by the company he keeps." This is a very important rule to remember because con men almost always belong to the same network. You will see the same con artists interviewing each other,referencing each other, (e.g. a hat tip) on the same blog rolls, attending the same conferences, mentioning their con artist peers, and so forth.
Rule #3: There's NO Free Lunch.
Whenever something is marketed as being "free" you can bet the item or service is either useless or else the ultimate price you'll pay will be much greater than if you had paid money for it in the beginning.
You should always seek to establish a monetary relationship with all vendors because this establishes a financial link between you the customer and the vendor. Therefore, the vendor will tend to serve and protect your best interests because you pay his bills.
Those who use the goods and services from vendors who offer their products for free will treated not as customers, but as products, because these vendors will exploit users who are obtaining their products for free in order to generate income.
Use of free emails, free social media, free content is all complete garbage designed to obtain your data and sell it to digital marketing firms.
From there you will be brainwashed with cleverly designed ads. You will be monitored and your identity wil eventually be stolen.
Fraudsters often pitch the "free" line in order to lure greedy people who think they can get something for free.
Perhaps now you understand why the system of globalized trade was named "free trade."
As you might appreciate, free trade has been a complete disaster and scam designed to enrich the wealthy at the expense of the poor.
There are too many examples of goods and services positioned as being free, when in reality, the customers get screwed.
Rule #4: Beware of Manipulation Using Word Games.
When manipulators want to get the masses to side with their propaganda and ditch more legitimate alternatives they often select psychologically relevant labels to indicate positive or negative impressions.
For instance, the financial parasites running America's medical-industrial complex have designated the term "socialized medicine" to replace the original, more accurate term, "universal healthcare." This play on words has been done to sway the masses from so much as even investigating universal healthcare, because the criminals want to keep defrauding people with their so-called "market-based" healthcare scam, which has accounted for the number one cause of personal bankruptcies in the USA for many years.
When Wall Street wanted to convince the American people to go along with NAFTA, they used the term "free trade" to describe the current system of trade which has devastated the U.S. labor force.
In reality, free trade is unfair trade and only benefits the wealthy and large corporations.
There are many examples on this play on words such as the "sharing economy" and so on.
Rule #5: Whenever Someone Promotes Something that Offers to Empower You, It's Usually a Scam.
This applies to the life coaches, self-help nonsense, libertarian pitches, FIRE movement, and so on.
If it sounds too good to be true, it usually is.
Unlike what the corporate fascists claim, we DO need government.
And no, you can NOT become financially independent and retire early unless you sell this con game to suckers.
Rule #6: "Never argue with stupid people. They will drag you down to their level and then beat you with experience." –Mark Twain
Following this rule is forcing the small and dewindling group of intelligent people left in the world to cease interacting with people.
You might need to get accustomed to being alone if you're intelligent and would rather not waste your time arguing with someone who is so ignorant, that they have no chance to realize what's really going in this world.
It would seem that Dunning-Kruger has engulfed much of the population, especially in the West.


.jpg)
.jpg)